Sooner or later everyone who uses LaTeX to typeset documents containing maths will encounter the problem of how to draw commutative diagrams. There are many packages, some general purpose other specialized for the task. An excellent survey of some of these alternatives by James Milne can be found here.
I use TikZ for most drawings I use in documents, so naturally I also want to use TikZ to draw commutative diagrams. The survey by Milne includes a description of how to use the matrix librariy in TikZ to typeset commutative diagrams which is a good way to do it. I, on the other hand, do not use the matrix library and that’s the reason for writing this blog post.
Each TikZ drawing is enclosed in the tikzpicture environment. You can set options for the drawing at hand by enclosing them in square backets like, for instance:
\begin{tikzpicture}[node distance=2cm, auto]
\end{tikzpicture}
If you want to set options globally or for entire parts of a document,
you can use the command \tikzset:
\tikzset{node distance=2cm, auto}
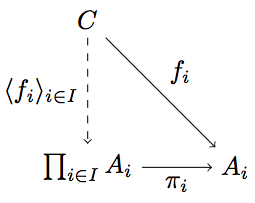
Now, let’s look at the source code for a simple diagram (for n-ary products in category theory).
\begin{tikzpicture}
  \node (C) {$C$};
  \node (P) [below of=C] {$\prod_{i \in I} A_i$};
  \node (Ai) [right of=P] {$A_i$};
  \draw[->] (C) to node {$f_i$} (Ai);
  \draw[->, dashed] (C) to node [swap] {$\langle f_i \rangle_{i \in I}$} (P);
  \draw[->] (P) to node [swap] {$\pi_i$} (Ai);
\end{tikzpicture}
You see that all commands are terminated by a semicolon. Nodes are given
names like C or P in parentheses and a label that is to be displayed in
the diagram enclosed in curly braces. The position of nodes relative to
each other is given by human-readable attributes like above of. These
positioning attributes can also be combined, for example [above of=A,
below of=C]. The arrows between nodes are drawn using the \draw
command which also takes attributes giving the type of arrow head or line
style enclosed in square braces. They are labelled using nodes. Again,
these nodes take attributes, the most used probably being swap which
indicates that the label should be drawn on the other side of the arrow.
And this is how the finished diagram looks like:
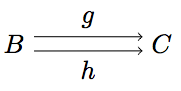
In diagrams like the ones for equalizers you’ll need parallel arrows. This can be achieved in TikZ by explicitly stating to with position on a hypothetical circle around the node in question the line should be anchored.
\draw[->] (A.20) to node {$g$} (B.160);
\draw[->] (A.340) to node [swap] {$h$} (B.200);
The numbers after the dot denote angles. In this example the line’s anchors at the source and destination node are offset by +20° and -20° respectively from their automatically assigned positions. This leads to the following drawing.
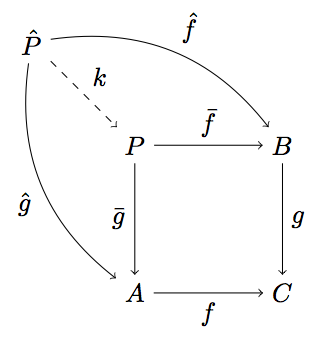
Another useful attribute of lines between nodes is bend. It allows you to draw lines that are curved to either the left or the right side of the straight line through its start and end point. A drawing that might use this is the commutative diagram of a pullback. Here’s the LaTeX code:
\begin{tikzpicture}
  \node (P) {$P$};
  \node (B) [right of=P] {$B$};
  \node (A) [below of=P] {$A$};
  \node (C) [below of=B] {$C$};
  \node (P1) [node distance=1.4cm, left of=P, above of=P] {$\hat{P}$};
  \draw[->] (P) to node {$\bar{f}$} (B);
  \draw[->] (P) to node [swap] {$\bar{g}$} (A);
  \draw[->] (A) to node [swap] {$f$} (C);
  \draw[->] (B) to node {$g$} (C);
  \draw[->, bend right] (P1) to node [swap] {$\hat{g}$} (A);
  \draw[->, bend left] (P1) to node {$\hat{f}$} (B);
  \draw[->, dashed] (P1) to node {$k$} (P);
\end{tikzpicture}
And this is the resulting figure:
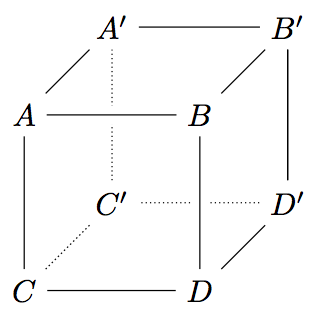
If you want to typeset a more complex diagram with lines crossing each other, this might help you:
\begin{tikzpicture}[%
  back line/.style={densely dotted},
  cross line/.style={preaction={draw=white, -,line width=6pt}}]
  \node (A) {$A$};
  \node [right of=A] (B) {$B$};
  \node [below of=A] (C) {$C$};
  \node [right of=C] (D) {$D$};

  \node (A1) [right of=A, above of=A, node distance=1cm] {$A^\prime$};
  \node [right of=A1] (B1) {$B^\prime$};
  \node [below of=A1] (C1) {$C^\prime$};
  \node [right of=C1] (D1) {$D^\prime$};

  \draw[back line] (D1) -- (C1) -- (A1);
  \draw[back line] (C) -- (C1);
  \draw[cross line] (D1) -- (B1) -- (A1) -- (A)  -- (B) -- (D) -- (C) -- (A);
  \draw (D) -- (D1) -- (B1) -- (B);
\end{tikzpicture}
This example draws a cube. The way the edges are drawn is special. First
of all two different line styles are defined, namely back line for
lines in the back (which would be invisible if the cube were solid) and
cross line for a line that is to be broken by crossing lines. Note,
that you first have to draw the lines in the back and then all the others
in the front that may or may not cross other lines and cause these to
be broken at the point of intersection. The result looks like this:
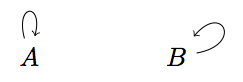
Another kind of arc which might be useful (although probably not so much in commutative diagrams but rather when drawing automata for example) is a loop. The following TikZ snippet shows two ways to create arrows. Instead of above you can also use all the other symbolic anchors like right or below. The second uses angles that offset the start and end anchor point of the line that were already mentioned.
\begin{tikzpicture}
  \node {$A$} edge [loop above] (A);
  \node [right of=A] {$B$} edge [out=10, in=50, loop] (B);
\end{tikzpicture}
And this is the resulting picture:
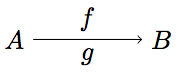
Just one more thing. How to draw arrows with two labels, one above and one below? This is easy to do.
\begin{tikzpicture}
  \node (A) {$A$};
  \node [right of=A] (B) {$B$};
  \draw[->] (A) to node[above] {$f$} node[below] {$g$} (B);
\end{tikzpicture}
This will get you a drawing like this:
And that’s it for now. Don’t think this is the be all and end all of drawing certain diagrams with TikZ. There are many ways and mine is probably still not the quickets and most elegant. It’s just what I do (for now).